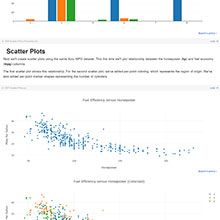
Creates a Plotly plot in the display with the specified data and layout.
dict, list, typing.Any
The Plotly trace data to be plotted.
None
dict, typing.Any
The layout data used for the plot.
None
float
The display scale with units of fractional screen height. A value of 0.5 constrains the output to a maximum height equal to half the height of browser window when viewed. Values below 1.0 are usually recommended so the entire output can be viewed without scrolling.
0.5
dict, typing.Any
In cases where you need to create a figure instead of separate data and layout information, you can pass the figure here and leave the data and layout values as None.
None
bool
If true, the plot will be created without interactivity. This is useful if you have a lot of plots in your notebook.
False


