Documentation
Documentation
API Reference
API Reference
cauldron.display
bokehcode_blockelapsedheadheaderhtmlimageinspectjinjajsonlatexlistinglist_gridmarkdownplotlypyplotstatussvgtabletailtextwhitespacecauldron.display
bokehcode_blockelapsedheadheaderhtmlimageinspectjinjajsonlatexlistinglist_gridmarkdownplotlypyplotstatussvgtabletailtextwhitespacecauldron.project
stopcauldron.project
stopdef
bokehAdds a Bokeh plot object to the notebook display.
model
Any
The plot object to be added to the notebook display.
scale
float
How tall the plot should be in the notebook as a fraction of screen height. A number between 0.1 and 1.0. The default value is 0.7.
Default Value:
0.7
responsive
bool
Whether or not the plot should responsively scale to fill the width of the notebook. The default is True.
Default Value:
True
Basic Usage
info_outline
No special initialization necessary to use Bokeh in Cauldron
01
02
03
04
05
06
07
08
09
import cauldron as cd
from bokeh.charts import Bar
from bokeh.sampledata.autompg import autompg as df
# Create bar chart from data frame
bar_plot = Bar(df, label='cyl', title='Distribution of Cyclinders')
# Add the bar chart to the notebook
cd.display.bokeh(bar_plot)
Examples

Bokeh Basics
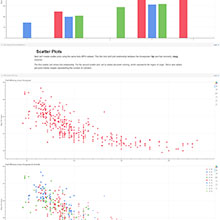
Basic plotting with Bokeh inside Cauldron. Uses the Auto MPG
dataset to create bar and scatter plots.

